Function list of GIS system |
System Module | Function Module | Detailed Functions | Function Description |
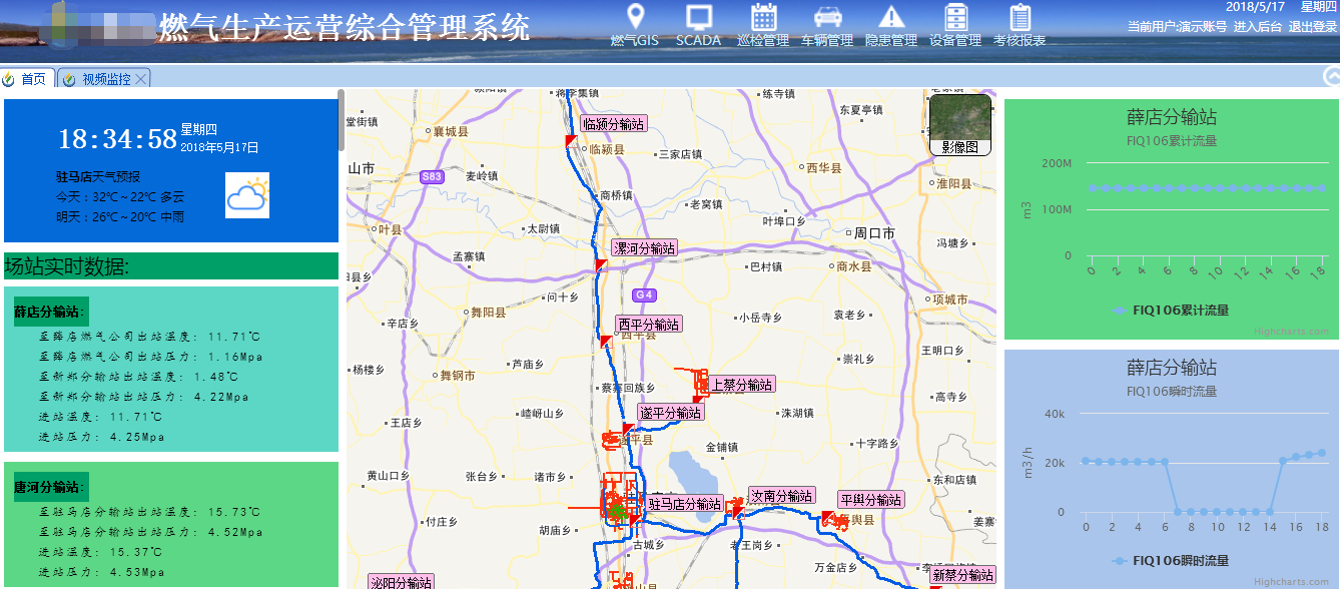
GIS System | GIS Map Display Function | Map browsing | The system provides a variety of map browsing tools, including: , zoom in, zoom out, full image display, smooth roaming, street image image switching, graphic measurement, layer control |
Gauge tool | Coordinate measurement: Provides measurement of the coordinates of any point on the map, and can provide conversion display of different coordinate systems. Distance measurement: Provides measurement of the distance between any two points on the map, measurement along the facility, or cumulative distance measurement of multiple points. Area measurement: The measurement of the relevant area is completed in the form of a rectangle, a circle, a polygon, and the like. |
Co-ordinate display | When the mouse is over the graph, the system automatically displays the coordinate position of the graph. When the mouse moves, the coordinate values will change automatically. |
Dynamic Attribute Notes of Pipeline and Station Map |
| Through the configuration, the dynamic identification display of the attribute information in the pipe network, the station layer, and other thematic layers can be performed according to the pipe network and the station direction. |
Thematic Maps |
| Publish the special map of pipe network and station graphic data, and quickly browse, pipeline, valve, pressure regulating box, station and other topics. |
DOM Image Display Control |
| The image data can be displayed in the current map and superimposed on the pipeline. |
GIS Statistical Analysis Function | Information query statistics based on graphic mode | The system provides a variety of graphical methods, which is convenient for users to query graphical information, including single point query, pull frame query, pull circle query, polygon query, etc. The system will automatically search and display detailed information and statistics of related objects, and graphical objects. Dynamic flashing. The system provides a way for the multimedia information of related objects to provide a hot connection, and the user can directly browse and play related multimedia information such as pictures and videos. |
Quickly search and location | Single positioning and overall result set positioning based on attribute information of the specified device classification. When the user enters the search content, the first letter of Chinese Pinyin can be used for quick screening. |
Attribute information query, search and location function | The system can separately query the pipeline attributes (pipeline type, material, pipe diameter, construction time, location, etc.), pipe point properties (measuring point properties, ancillary facilities), and the topological relationship between pipelines and pipe points. Fixed value query for attribute data Conditional query of attribute data |
Multimedia information query and display | When the system performs information inquiry, it automatically prompts whether there are multimedia files associated with the pipe network and station components, such as the picture or video file of the gate well, which is attached to the corresponding gate, so that the user can not only query the gate through the system. The attribute can also browse related multimedia files; the multimedia information can be directly superimposed and displayed according to the GPS coordinates at the time of shooting. |
Common report function | The query results obtained by query statistics are printed out in a report format. Includes query result report and fixed format report. |
Distribution of dangerous source | The system provides a hazard source distribution query function to group all current hazard sources according to different hazard categories. By clicking on different hazard source records, the system automatically zooms to the spatial position of the corresponding pipeline and displays the basic attribute information of the hazard source and the live image. |
GIS Applied Analysis Function | Analysis of valve-turnoff | According to the known position of the squib, a blasting point is set on the relevant pipeline in the system, and the system performs automatic valve closing analysis. The red blasting point mark is the squib position. Valves that are affected to be closed are highlighted in blue with the relevant symbols, and the affected pipeline is highlighted in blue. At the same time, the view is automatically scaled to the relevant scale to display the analysis results. On the right side of the view, the results of the squib analysis are displayed in the form of a text list, including the location information of the squib position and the statistical information affecting the pipeline, affecting the valve and other influencing facilities. |
Analysis of secondary valve-turnoff | After the first valve closing analysis, the system provides a secondary shut-off valve analysis when the valve failure cannot be closed. Through the secondary valve closing analysis column, select the failed valve on the map window, the selected valve will be set to failure, will be represented by different color icons, click the "secondary analysis" button, the system will be based on the set failure valve twice analysis. |
Analysis of affected area | Click the “Affected Area” button, the system will automatically analyze the affected end facilities and affected user information after closing the valve. And highlight the relevant facilities in blue. |
Analysis of transverse section | The schematic diagram of the buried depth of the pipeline is shown in the form of a cross section, and the cross-sectional view of any pipe network and station is automatically generated according to the cross-section parameters set by the plane pipe pattern, the spatial information of the pipe network and the station. |
Analysis of longitudinal section | The schematic diagram of the buried depth of the pipeline is shown in the form of a longitudinal section. The longitudinal profile of the pipe network and the station is automatically generated according to the longitudinal profile parameters set by the plane pipe pattern, and the longitudinal profile of any pipe network and station. |
Privilege Management |
| System maintenance is performed through the system background, including personnel maintenance, authority maintenance, and system parameter configuration. |
GIS Terminal Application System | Measurement function | The system needs to provide distance measurement between two points. After selecting two points, the application automatically calculates the length of the selected segment. Through the area measurement tool provided by the system, the application automatically calculates the area of the graphic after drawing the graphic. |
Layer control | Customize the hidden and displayed layers such as “pipeline, valve”, “user”, etc. Click the layer control button to display and hide the list. |
Analysis of valve-turnoff | Zoom in to a certain extent, find the valve or pipeline that needs to be analyzed and click to have a blue dot. If the network is in good condition and the point is valid, a dialog box is being displayed. After the analysis is completed, the green point is the valve and the light blue long line is the pipeline. |
Analysis of transverse section | The schematic diagram of the buried depth of the pipeline is shown in the form of a cross section, and the cross-sectional view of any pipe network and station is automatically generated according to the cross-section parameters set by the plane pipe pattern, the spatial information of the pipe network and the station. |
Analysis of longitudinal section | The schematic diagram of the buried depth of the pipeline is shown in the form of a section, and the longitudinal section parameters set according to the plane piping pattern. |
Query function | A query information table is generated, and attribute information of each device can be queried. |
Statistic function | The number of device types and the length of the pipeline can be counted. |
Search and query of equipment account | The system provides a list of device layers, which can be displayed in an optional layer, and provides a click on one of the devices, which will locate the corresponding location in the map, and display the details of the device in the form of a pop-up box. |